
Definition of a trend
In terms of price formation on the exchange, a trend is a pronounced development in the valuation of a security over time in a particular direction. It forms through an initial move in one direction, a subsequent correction against that initial move, and the resumption of the original direction, in which the price rises above the first high or falls below the first low. A trend can be in one of three states: an uptrend, a downtrend or a sideways phase, which is also described as trendless.
Uptrend
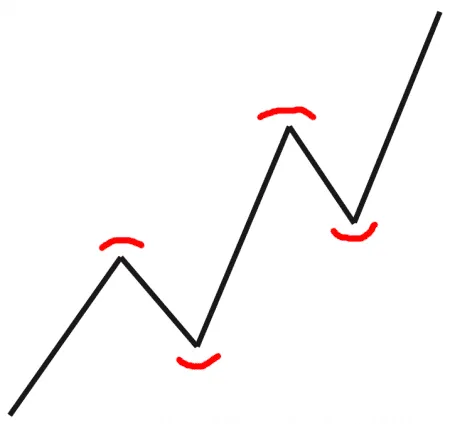
An uptrend is characterised by each new high being higher than the previous high and each new low also being higher than the previous low. In other words, the turning points keep rising.
Downtrend
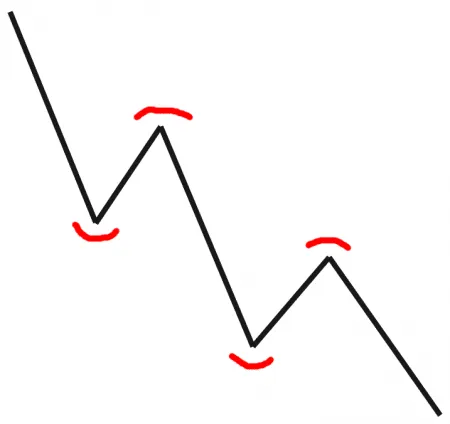
A downtrend is characterised by each new low being lower than the previous low and each new high also being lower than the previous high. In other words, the turning points keep falling.
Sideways phase
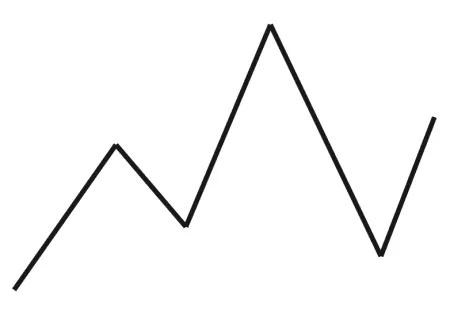
A sideways phase is characterised by the conditions for neither an uptrend nor a downtrend being met. The market is therefore in a trendless phase.
Trend phases
The two phases of a trend – movement and correction – each have characteristic features. The more pronounced these features are, the more significant the trend is for trading.
Movement
A movement usually unfolds quickly and smoothly over just a few candles in the direction of the trend. It typically produces large candle bodies: in an uptrend, the closing price is near the top of the candle; in a downtrend, near the bottom. So the candles alone show that there is considerably more buying or selling pressure in the movement phase than in the correction phase. Volume usually rises during a movement.
Correction
A correction is usually sluggish and slow. It runs against the direction of the trend and can even develop into a subordinate trend of its own. Most corrections are rather messy, however, so the subordinate trend within them is often broken several times. A correction can retrace up to 100% of the preceding movement without invalidating the current trend. Volume tends to dry up during a correction.
Trend sizes
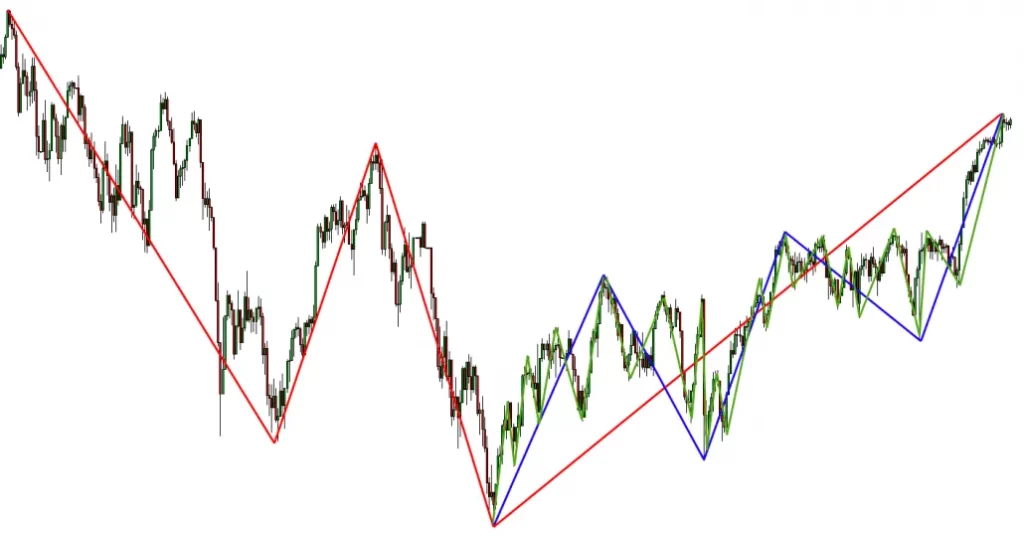
The real difficulty in trading lies in recognising trends. A trend always unfolds on several trend sizes at once, so a trader has to recognise which trend phase the market is in within a particular trend size. In the figure below, the different trend sizes are shown in colour: the red trend is the largest, the blue trend is the medium one and the green trend is the smallest. A chart may well contain more than three trend sizes.
So different trend sizes can be seen in every chart. To make the smaller trend sizes easier to see, it helps to switch the timeframe of the chart; this makes the subordinate trends more clearly visible. It also highlights the difference between trend sizes and timeframes: the two have nothing to do with each other. The choice of timeframe has no influence on the trend sizes. Trend sizes exist in every chart and are more or less clearly visible, regardless of the selected timeframe and zoom level.
Trend break
A trend is considered broken when:
- in an uptrend, the price falls below the last low;
- in a downtrend, the price rises above the last high.
After a trend break, the market is trendless. Professional traders now wait to see how the market develops and usually stay flat until a new trend has been established. At such important points, however, stop hunting often occurs, after which the old trend resumes. It is therefore essential to look closely at how forcefully a trend is broken.
A trend break is not the only sign that a trend may no longer be intact. A counter-signal can also form on the same trend size and call the old trend into question. The following figure illustrates this.
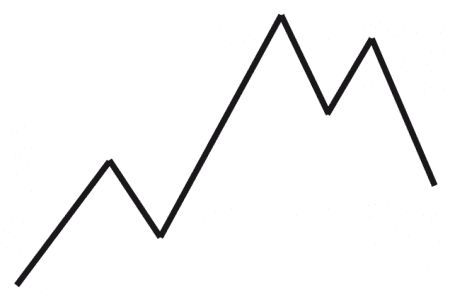
The old uptrend is still intact, but a downtrend of the same size has formed in the opposite direction. Most market participants will probably now pay more attention to the new trend than to the old one.
What is a counter-signal?
A counter-signal is an opposing trend of the same trend size that breaks the existing trend without the price breaking through that trend's last point 3. In market technique, point 3 is the turning point at the end of the most recent correction – the last correction low in an uptrend or the last correction high in a downtrend. In this way, an established downtrend can be broken and replaced by a counter-signal in the form of an uptrend: after a new low, the price rallies, pulls back to a higher low and then rises above the high of its first rally. An uptrend of the same size has formed, even though the price is still below the downtrend's last point 3.
How does a trend form?
A trend arises from the interplay of market participants. Its cause can be fundamental, political or of some other nature. What you ultimately see on the chart is the sum of all the actions of all market participants.
Sooner or later, the first movement of a security has to be followed by a correction, because the market participants who entered at the beginning of the move start taking profits. In addition, fewer and fewer traders are willing to buy, because prices have already moved so far. The result is the correction phase, in which the first movement is retraced in full or in part. Then more and more market participants come back into the market: they missed the initial move and now see the correction as a favourable entry opportunity. This marks the beginning of a new movement.
Many institutional investors have so much capital that they can only build a position in a security step by step. When such investors want to buy a security, they tend to buy precisely during the correction phases. This behaviour is particularly visible on the chart when volume rises in the direction of the move and fast, decisive movements occur.