
Stop Rules in Market Technique
Rules for placing and trailing stops purely on the basis of chart structure – beyond the last point 3 when trading the trend, or at the last candle's high or low when trading the movement.
Approx. 9 min read · Updated October 9, 2026
Risk and money management is one of the most important aspects of trading, and almost every text on the subject repeats the maxim "cut your losses and let your profits run". A full treatment of stops, however, goes far beyond the initial risk – that is, limiting losses. It is just as much about how to let profits run and how to trail stops sensibly so that partial profits can be locked in. This entry first gives a brief overview of the different types of stop and then looks specifically at how stops are handled in trading based on market technique.
Types of stop
There are two basic types of stop: the loss-limiting stop and the profit-taking stop.
Loss-limiting stop
The loss-limiting stop is the best known. It is also called a stop-loss or initial-risk stop, and its purpose is to know the risk from the moment a position is opened – and so to fix the maximum loss in advance. A stop is not, however, a 100% guarantee that this maximum loss will hold. When the stop price is reached, a stop order automatically becomes a market order and is executed at the next available price. The fill can therefore be much worse than planned if there are no matching orders on the other side of the market at that price. This is also why professional traders stick to liquid instruments: it keeps the risk of a significantly worse fill to a minimum.
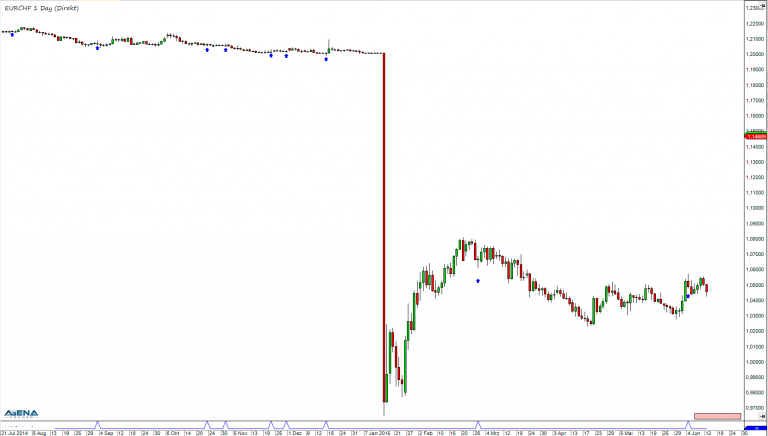
A good example of this risk is the Swiss franc shock of 15 January 2015. On that day, the Swiss National Bank (SNB) abandoned the minimum exchange rate of 1.20 francs per euro that it had introduced in 2011. Traders who were long EUR/CHF had placed their stop orders just below the 1.20000 mark – and were badly caught out when the rate plunged far below that level within minutes and many stops were filled well below their stop price.
There are several approaches to setting a loss-limiting stop:
- Fixed nominal amount: a fixed sum of money is put at risk. If, for example, a trader is prepared to risk $50 per position, the stop is placed exactly where that amount would be lost – which, of course, depends on the position size.
- Percentage of capital: a percentage of total capital is put at risk. Anyone willing to risk 1% of a $5,000 account may risk at most $50 per trade. The position size is then derived from the stop distance and this maximum risk – with a stop distance of $2 per share, for example, no more than 25 shares.
- Volatility stop: volatility indicators are used to take the market's current range of fluctuation into account. In calm phases with low volatility, the stop sits closer to the entry price than in more volatile phases.
- Stop based on market technique rules: the chart – and therefore the market – decides when a setup is no longer valid and the stop is triggered.
Profit-taking stop
The profit-taking stop is at least as important as the initial stop, because every trader also needs rules for protecting and taking profits. For this reason, stops are trailed behind the price according to set rules. A stop is referred to as a profit-taking stop as soon as it reaches the position's break-even point; from that moment on, the position is considered risk-free – apart from the slippage risk described above. Here, too, there are different approaches to trailing a stop:
- Fixed amount (money stop): with the so-called money stop, a fixed nominal amount is chosen as the stop distance. If the price moves in the trader's favour, the stop is trailed by the same amount. Daily or hourly closing prices are usually used as the reference, so that not every small price change leads to the stop being moved.
- Percentage (percent stop): the percent stop works in principle like the money stop, except that the stop is trailed at a fixed percentage distance. Both the money stop and the percent stop are trailing stops, which follow the price automatically.
- Indicator stop: an indicator is used to trail the stop. One example is the Average True Range (ATR), which reflects market volatility; the stop is then trailed at a multiple of the ATR. Another application is closing the position automatically when an indicator reaches a certain overbought or oversold zone.
- Stop based on market technique rules: the chart – and therefore the market – decides how and when the stop is trailed. This is explained in detail in the following sections.
Stop rules in market technique
As mentioned above, setting stops according to market technique means letting the market decide when a setup is no longer valid and the trade idea has therefore failed. When opening a position, the trader knows why this setup is considered more likely to end in profit than other setups. For exactly this reason, the stop can be placed at the point where the setup is no longer valid.
Both the initial stop and the profit-taking stop are based on the naked price chart: neither an indicator nor a fixed or percentage trailing stop is used – the market alone decides when a position is stopped out. For each, there are two basic strategies: trading the trend and trading the movement. Trends are described using points 1, 2 and 3 (P1, P2, P3); P3 marks the end of the latest correction – the last higher low in an uptrend or the last lower high in a downtrend.
Initial stop when trading the trend
When trading the trend, the stop is always placed below the last point 3 (long position) or above it (short position). In other words, the stop sits exactly where the trend would be broken. The following chart illustrates this.
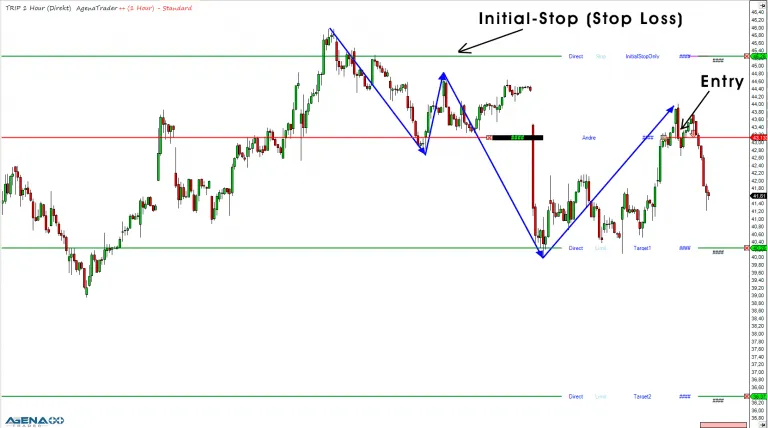
In this example, the trend on the higher timeframe – the "big picture" – is in a correction and is not shown in the chart. The blue arrows mark the signal trend, i.e. the trend on the signal timeframe used to time the entry. The trade was entered after a first lower-order trend had formed on the signal timeframe and was now itself in a correction (setup 2, the entry in the correction). The stop therefore belongs where the trade idea fails: at the point where this lower-order trend would be broken. As the last P3 was at $44.81, that is strictly where the stop belongs. It was set at $45.26 instead, because some room is always left between the last P3 and the stop so that market noise cannot trigger it unnecessarily.
Initial stop when trading the movement
Movement trading aims to capture the movement up to the next P2 and beyond. Movements are characterised by being fast and brisk. This means that, after entering the position, a trader must expect it to move into profit quickly – that is the basic idea behind a movement trade.
Accordingly, when a short position is opened, the first initial stop is placed at the high of the last candle; for a long position, it goes at the low of the last candle. The trade idea explains why the stop belongs exactly there: if the position does not get going quickly as planned and the price then rises above the candle high (short position) or falls below the candle low (long position), the trade idea has failed. That is precisely why the stop sits at this level.
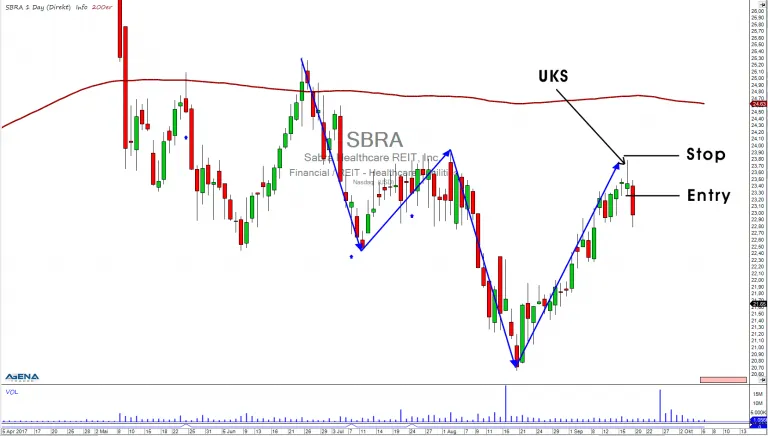
The following chart shows an example of a stop in movement trading for a short position. A reversal bar was used as the entry signal: the entry is just below the reversal bar, and the initial stop sits above the last candle high.
Trailing the stop when trading the trend
When the stop is trailed according to trend trading, it is always moved to the next P3 of the trend being traded – below each new P3 in an uptrend and above each new P3 in a downtrend. In a typical example, the higher timeframe provides the big picture, while the trend on the signal timeframe is the one being traded. The entry is a P2 trade (setup 1), and from then on the stop is always trailed to the latest P3.
Trailing the stop when trading the movement
In movement trading, the stop is always placed at the high (short position) or the low (long position) of the last period, taking inside bars into account. Inside bars – bars whose high and low both lie within the range of the previous bar – have a special significance in market technique. When one appears, it shows that the market currently has no clear direction. Many market participants therefore hold back from opening new positions, so liquidity is lacking – which in turn produces the typical inside-bar pattern. To avoid being stopped out of a movement trade unnecessarily, the stop is therefore moved back by one period when an inside bar appears.
Here is how this worked in a short trade on a daily chart: the entry signal was a reversal bar on 18 September 2017, and the stop was placed above the reversal bar at about $23.94. The next day closed well below the low of the reversal bar, so the stop could be moved down. The day after that failed to make a new low, so the stop was set back to $23.94. Another day with a new low followed, which allowed the stop to be moved to the high of 21 September 2017 – and from then on, the stop was trailed in the same way.
Split stops
The more experience traders gain, the more they try to get the most out of each trade. Working with split stops is a good way to do this. Of course, it is only possible if the position is large enough to be divided – the strategy cannot be implemented with a single contract.
For example, one stop can be managed according to movement trading and another according to trend trading. Alternatively, one stop can follow the daily trend and the other the hourly trend. In this way, the position can be taken out of risk very early without giving up the chance of further profits. Many traders always leave a small remaining position open and manage it on the very large trend. This lets them ride the wave of the "big money" and, every now and then, capture a very large move with a single trade.
Cashback angle
Cashback is paid on every lot you trade – up to $4.40 per lot at RoboForex.
Get deal** Affiliate link (advertising)
More terms.
- Trading Setups in Market TechniqueTrading setups in market technique are rule-based entry scenarios in the direction of the trend: the point 2 trade, the entry in the correction and the fuzzy entry.
- Risk ManagementRisk management in trading means deciding how much of the total capital to risk on each trade and across all open positions, and adjusting that risk to market conditions.
- Money ManagementMoney management is the set of rules that determines how much capital a trader invests and risks per trade and in total, with the aim of protecting the account from large losses.
- Break-EvenBreak-even is the point at which the revenue from trading exactly covers all costs, so that there is neither a profit nor a loss.