
Dow Theory
The Dow theory, developed by Charles H. Dow in the late 19th century, holds that prices move in trends. Its tenets are the foundation of modern technical analysis.
Approx. 3 min read · Updated October 9, 2026
The Dow theory was developed by Charles Henry Dow in the late 19th century and is regarded as the cornerstone of modern technical analysis. Dow held that observing past price movements makes it possible to draw conclusions about future price developments. To be able to assess the development of the market as a whole, he created the Dow Jones Industrial Average, which formed the basis of his thinking. From his observations, a set of basic assumptions emerged that can be summarised in seven tenets. They also form the foundation of market technique.
The seven tenets of the Dow theory
1. The index reflects all information in the market
The basic idea behind the Dow Jones Industrial Average was to create a market barometer that reflects the market as a whole. Dow assumed that all information is already priced in. If the market were perfectly efficient in terms of information, this would certainly be the case. In practice, however, such efficiency never exists, because not all market participants have access to all information at all times. What prices do reflect are the expectations of market participants, so the market mirrors these expectations. An index can therefore reveal certain tendencies in the markets.
2. Prices follow a trend
Prices do not move randomly; they move in the form of trends. How a trend forms and how it is defined is explained in the article on trends. In principle, however, a trend always consists of movements and corrections.
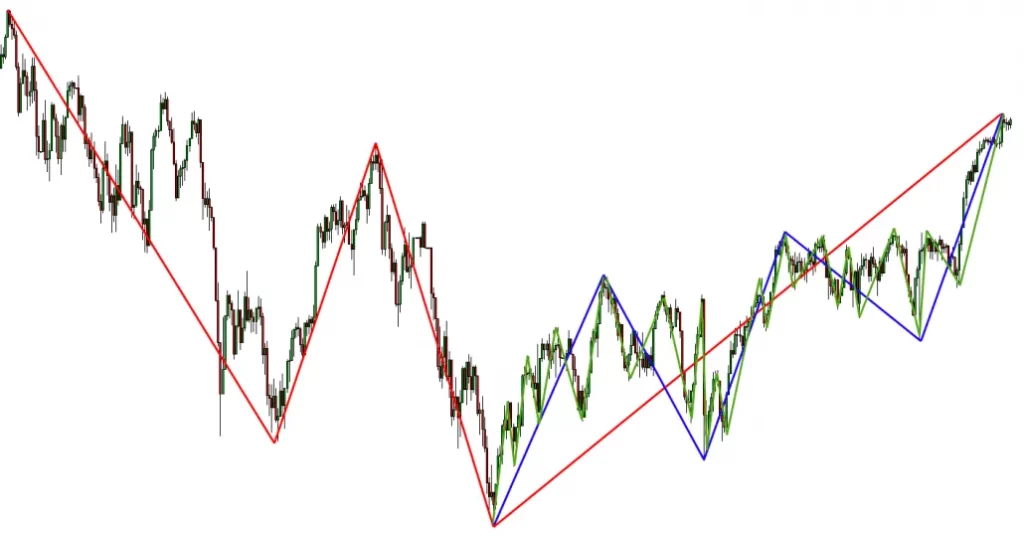
3. There are three trend sizes
The Dow theory distinguishes between three trend sizes:
- Primary trend: the large, very long-term trend
- Secondary trend: the medium-sized, medium-term trend
- Minor trend: the small, short-term trend
4. A trend has three phases
Described here for an uptrend, the three phases are:
Accumulation phase: This is the first phase of the movement, in which well-informed investors buy. They usually have an information advantage over other market participants and can therefore get in early.
Public participation phase: Rising prices during the accumulation phase attract more buyers, which marks the start of this trend-following phase. The further prices rise, the more investors are willing to enter the market, because they do not want to miss out on further gains. This continues until the distribution phase begins.
Distribution phase: In this phase, the investors who got in at the start of the movement take their profits. In theory, prices could keep rising, but the more mature the trend, the fewer investors are willing to buy at record highs. As a result, prices in the distribution phase may fall even when positive news comes out.
5. The indices must confirm each other
Charles Dow also created a second index – originally an average of railway stocks, today known as the Dow Jones Transportation Average – which brought together 20 of the largest transport companies. The idea was that the goods produced by industry have to be transported. If transport companies are doing well, this confirms a long signal in the Dow Jones Industrial Average. When signals in the industrial average are confirmed by the transportation average, the probability that the trend assessment is correct increases.
6. A trend persists until it is broken
As long as an uptrend keeps making new highs and does not fall below the preceding lows, the trend is considered intact. Only when the last low is broken is the trend regarded as broken. The same applies in reverse to a downtrend.
7. Trading volume confirms the trend
Dow also used trading volume as an additional indicator. In movement phases in the direction of the trend, volume rises, while it tends to decline during corrections. A departure from this pattern can be a warning sign that a trend reversal may be approaching.
Cashback angle
Cashback is paid on every lot you trade – up to $4.40 per lot at RoboForex.
Get deal** Affiliate link (advertising)
More terms.
- Trading Setups in Market TechniqueTrading setups in market technique are rule-based entry scenarios in the direction of the trend: the point 2 trade, the entry in the correction and the fuzzy entry.
- Stop Rules in Market TechniqueRules for placing and trailing stops purely on the basis of chart structure – beyond the last point 3 when trading the trend, or at the last candle's high or low when trading the movement.
- Line chartA line chart connects the closing prices of successive periods with a single line. It is the simplest type of price chart but shows no open, high or low.